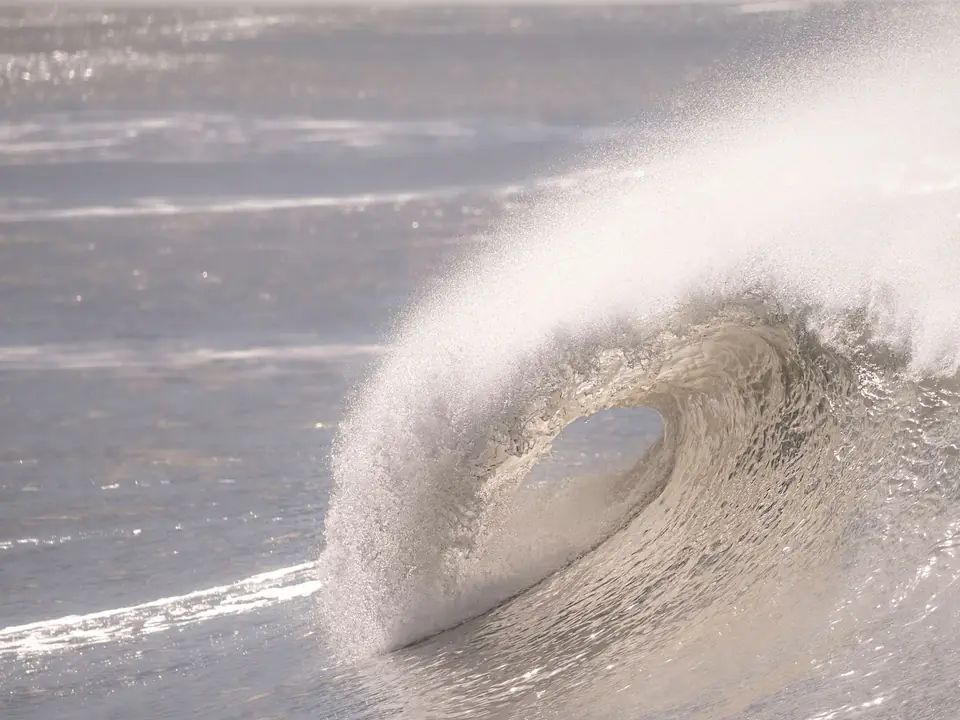
Cape Hatteras
North Carolina, USA
Sun, Nov 1 – Wed, Nov 4
- 3–4 ft · 10sSurf on your dates
- Is the fare low?Sign up to see
- BWI → ORFNearest airport
- 70°F waterSpringsuit
Get a phone alert when Cape Hatteras fires.
Get the iPhone appiPhone app

Know when Cape Hatteras fires and the flight from your airport is cheap.
Cheap Waves: cheap flights to firing waves. Unsubscribe anytime.
Cape Hatteras surf forecast
Better surfweekendMon 2 Nov – Thu 5 Nov
Updated
Trip dates
Friday, Oct 23
4ft2/10Best at dawn
- Swell
- 8s ENE
- Wind
- 14kt cross-shore
- Water
- 65°F
- Suit
- 3/2 fullsuit
- Light
- 7:15am to 6:17pm
- Dawn7:15 to 9am4ft11kt cross-shore2/10
- Morning9 to 11am4ft12kt cross-shore2/10
- Midday11am to 2pm4ft13kt cross-shore1/10
- Afternoon2 to 4pm4ft15kt cross-shore1/10
- Dusk4 to 6:17pm4ft17kt cross-shore1/10
Saturday, Oct 24
5ft1/10
Nothing worth a paddle. 4ft.
- Swell
- 6s ENE
- Wind
- 16kt onshore
- Water
- 65°F
- Suit
- 3/2 fullsuit
- Light
- 7:16am to 6:15pm
Sunday, Oct 25
5ft1/10
Nothing worth a paddle. 5ft.
- Swell
- 7s E
- Wind
- 19kt cross-shore
- Water
- 65°F
- Suit
- 3/2 fullsuit
- Light
- 7:17am to 6:14pm
Monday, Oct 26
5ft2/10
Nothing worth a paddle. 5ft.
- Swell
- 8s E
- Wind
- 19kt cross-shore
- Water
- 65°F
- Suit
- 3/2 fullsuit
- Light
- 7:18am to 6:13pm
Tuesday, Oct 27
4ft2/10Best at midday
- Swell
- 7s E
- Wind
- 12kt cross-shore
- Water
- 66°F
- Suit
- 3/2 fullsuit
- Light
- 7:19am to 6:12pm
- Dawn7:19 to 9am4ft11kt cross-shore2/10
- Morning9 to 11am4ft12kt cross-shore1/10
- Midday11am to 2pm4ft12kt cross-shore2/10
- Afternoon2 to 4pm4ft12kt cross-shore1/10
- Dusk4 to 6:12pm4ft13kt cross-shore2/10
Wednesday, Oct 28
3-4ft1/10
Nothing worth a paddle. 3ft.
- Swell
- 7s ESE
- Wind
- 17kt cross-shore
- Water
- 68°F
- Suit
- 3/2 fullsuit
- Light
- 7:19am to 6:11pm
Thursday, Oct 29
3ft3/10Best in the afternoon
- Swell
- 5s E
- Wind
- 11kt cross-shore
- Water
- 68°F
- Suit
- 3/2 fullsuit
- Light
- 7:20am to 6:10pm
- Dawn7:20 to 9am3-4ft11kt cross-shore2/10
- Morning9 to 11am3ft11kt cross-shore2/10
- Midday11am to 2pm3ft11kt cross-shore2/10
- Afternoon2 to 4pm3ft10kt cross-shore3/10
- Dusk4 to 6:10pm3ft11kt cross-shore3/10
Friday, Oct 30
3ft2/10Best at dawn
- Swell
- 6s ESE
- Wind
- 13kt cross-shore
- Water
- 65°F
- Suit
- 3/2 fullsuit
- Light
- 7:21am to 6:09pm
- Dawn7:21 to 9am3ft12kt cross-shore2/10
- Morning9 to 11am3ft13kt cross-shore2/10
- Midday11am to 2pm3ft14kt cross-shore2/10
- Afternoon2 to 4pm3ft13kt cross-shore2/10
- Dusk4 to 6:09pm3ft13kt cross-shore2/10
Saturday, Oct 31
2ft2/10
Nothing worth a paddle. 2ft.
- Swell
- 6s ESE
- Wind
- 16kt cross-shore
- Water
- 66°F
- Suit
- 3/2 fullsuit
- Light
- 7:22am to 6:08pm
Sunday, Nov 1
3ft2/10
Nothing worth a paddle. 2ft.
- Swell
- 5s E
- Wind
- 12kt cross-shore
- Water
- 70°F
- Suit
- Springsuit
- Light
- 6:23am to 5:07pm
Monday, Nov 2 Long range
10ft5/10Best at dusk
- Swell
- 13s E
- Wind
- 9kt cross-shore
- Water
- 70°F
- Suit
- Springsuit
- Light
- 6:24am to 5:06pm
- Dawn6:24 to 8am10ft10kt onshore2/10
- Morning8 to 11am10ft8kt cross-shore3/10
- Midday11am to 2pm10ft9kt cross-shore5/10
- Afternoon2 to 3pm10ft10kt offshore5/10
- Dusk3 to 5:06pm10ft10kt offshore5/10
Tuesday, Nov 3 Long range
8-10ft7/10Best at dusk
- Swell
- 13s E
- Wind
- 8kt offshore
- Light
- 6:25am to 5:05pm
- Dawn6:25 to 8am10ft12kt offshore5/10
- Morning8 to 11am9-10ft7kt offshore6/10
- Midday11am to 2pm8-9ft6kt offshore6/10
- Afternoon2 to 3pm8ft6kt cross-shore6/10
- Dusk3 to 5:05pm7-8ft4kt offshore7/10
Wednesday, Nov 4 Long range
4ft6/10Best at dusk
- Swell
- 11s E
- Wind
- 11kt offshore
- Light
- 6:26am to 5:04pm
- Dawn6:26 to 8am4-5ft15kt offshore5/10
- Morning8 to 11am4ft12kt offshore5/10
- Midday11am to 2pm4ft9kt offshore6/10
- Afternoon2 to 3pm4ft8kt offshore6/10
- Dusk3 to 5:04pm3ft7kt offshore6/10
Thursday, Nov 5 Long range
2ft4/10Best in the morning
- Swell
- 10s E
- Wind
- 8kt cross-shore
- Light
- 6:27am to 5:03pm
- Dawn6:27 to 8am2ft5kt cross-shore4/10
- Morning8 to 11am2ft6kt cross-shore4/10
- Midday11am to 2pm2ft8kt cross-shore3/10
- Afternoon2 to 3pm2ft10kt cross-shore3/10
- Dusk3 to 5:03pm2ft11kt cross-shore3/10
Friday, Nov 6 Long range
1ft2/10
Nothing worth a paddle. 2ft.
- Swell
- 5s SSW
- Wind
- 13kt cross-shore
- Light
- 6:28am to 5:02pm
Saturday, Nov 7 Long range
2ft2/10
Nothing worth a paddle. 2ft.
- Swell
- 6s E
- Wind
- 4kt onshore
- Light
- 6:29am to 5:02pm
Cape Hatteras surf guide
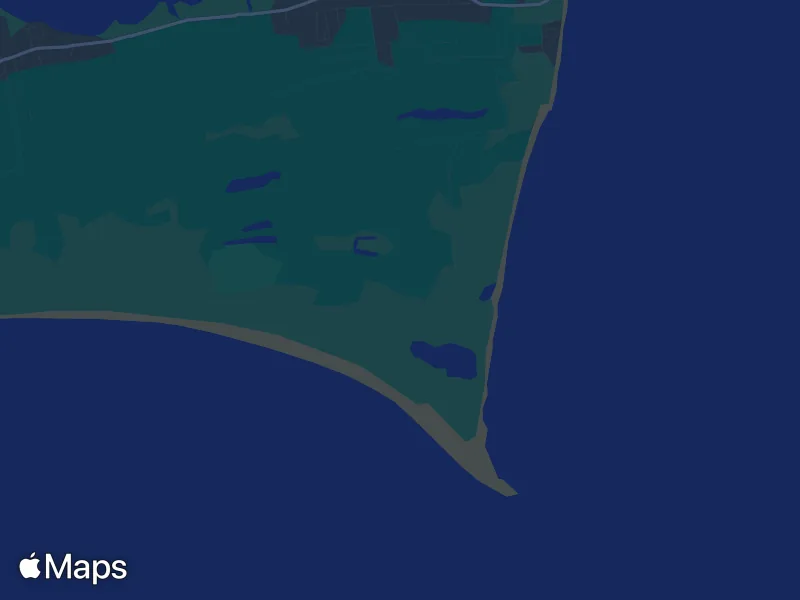
The wave. The Cape Hatteras Lighthouse break is a sand beach break set between old steel groins, with fast, hollow lefts and rights. The Navy sank the groins to protect a World War II outpost. The lighthouse, the tallest brick lighthouse in the United States, was moved 2,900 feet back from the eroding shore in 1999.
Who it suits. Small days suit most levels. In solid swell the groin waves turn heavy and hollow and suit experienced surfers.
Read the full guide, with its sources (checked Oct 2026).
Getting there
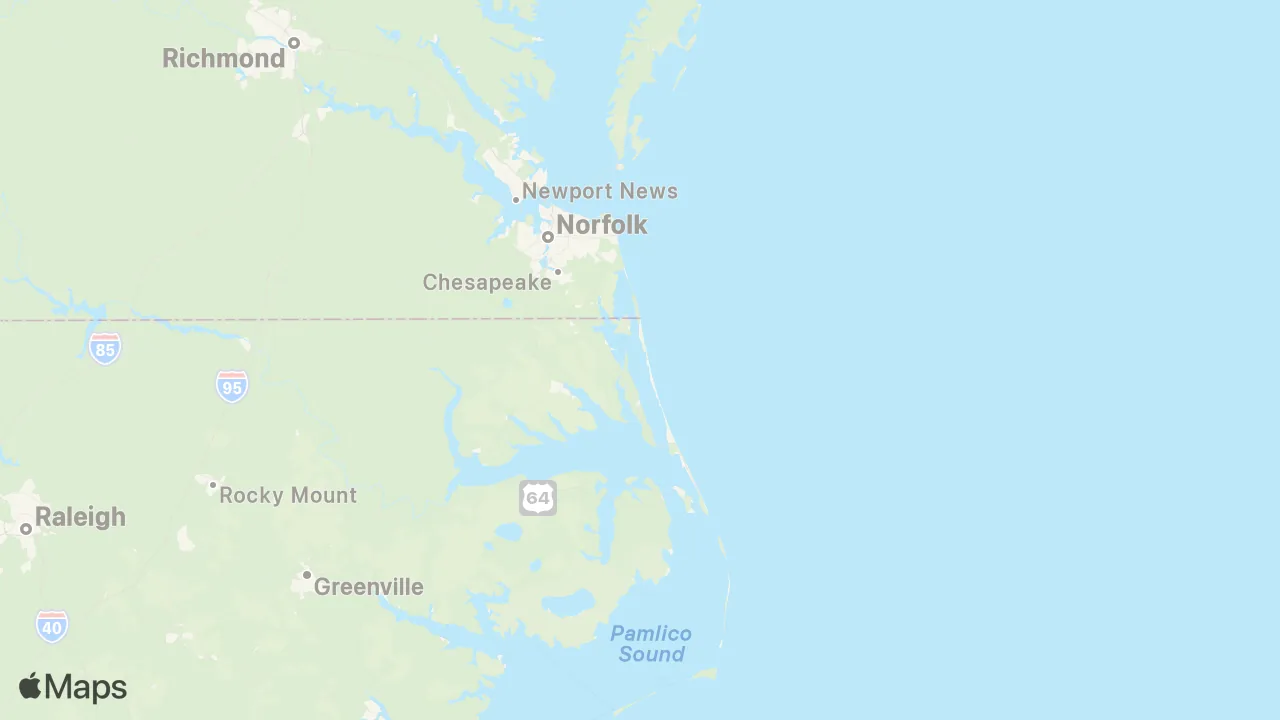
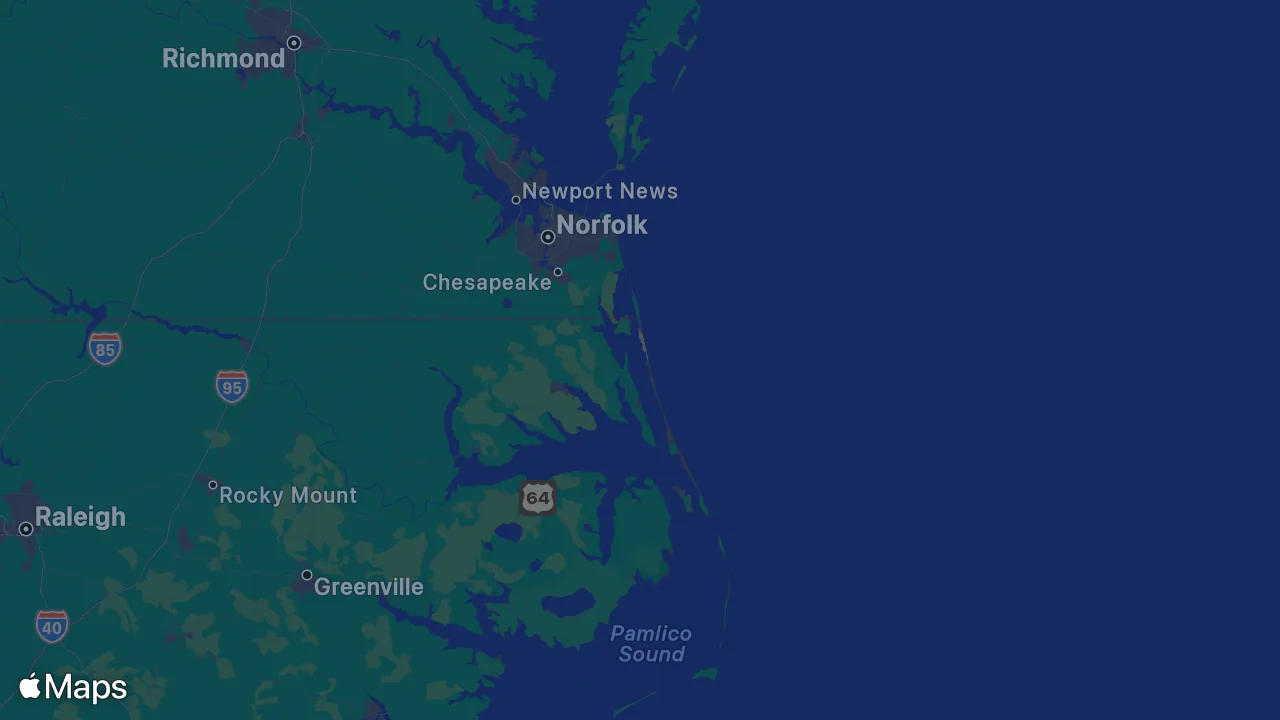
A haul, 3 hr 27 min from ORF
- ORF
- 226 km, about 3 hr 27 min
- the wave
Norfolk is the nearest airport. The drive down the Outer Banks takes about three hours.
Free-flow driving time, not traffic.
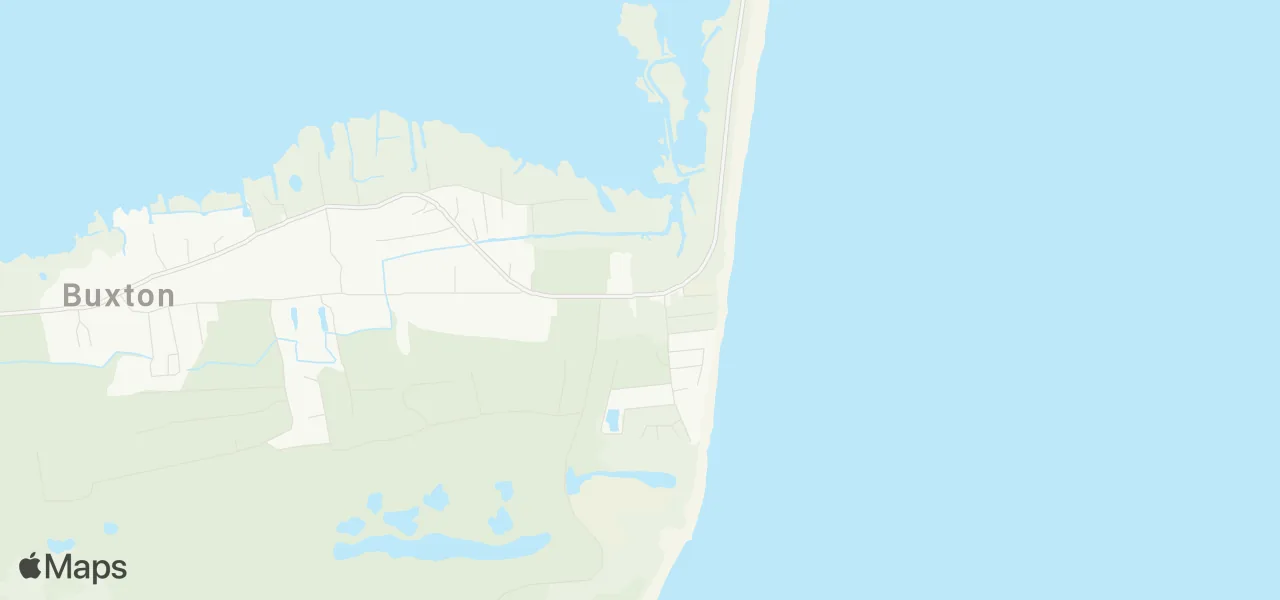
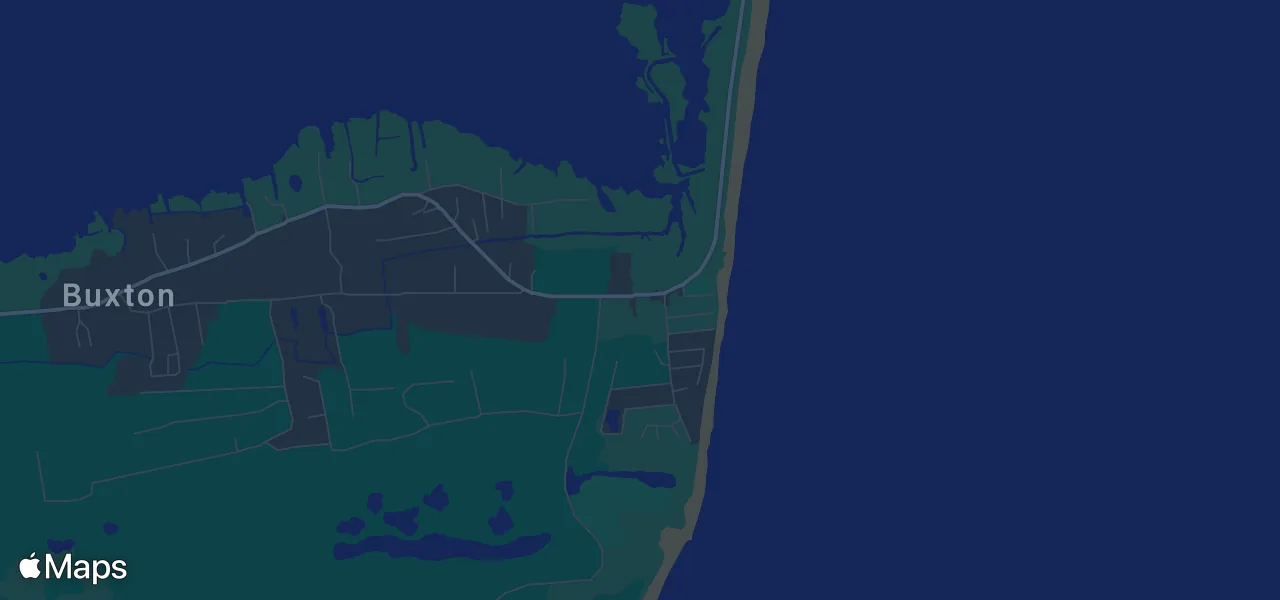 123456Arrival1 km
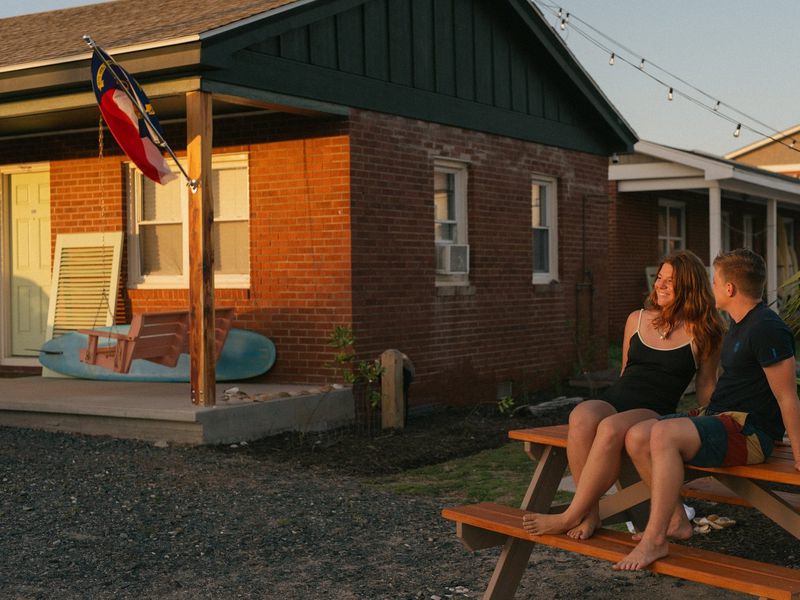
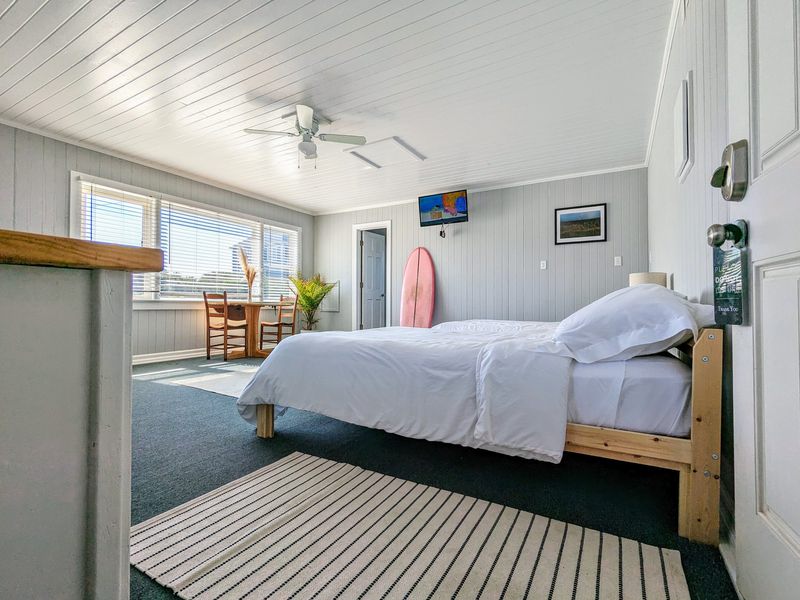
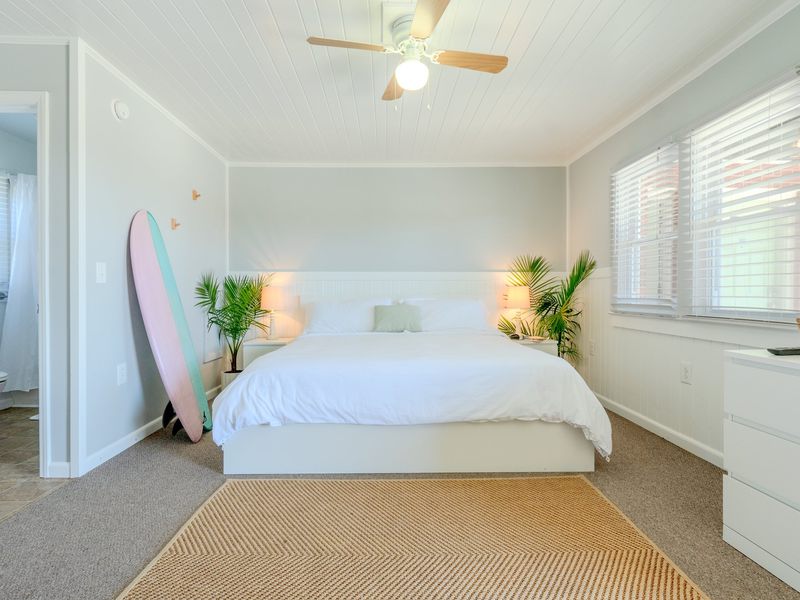
Where to stay
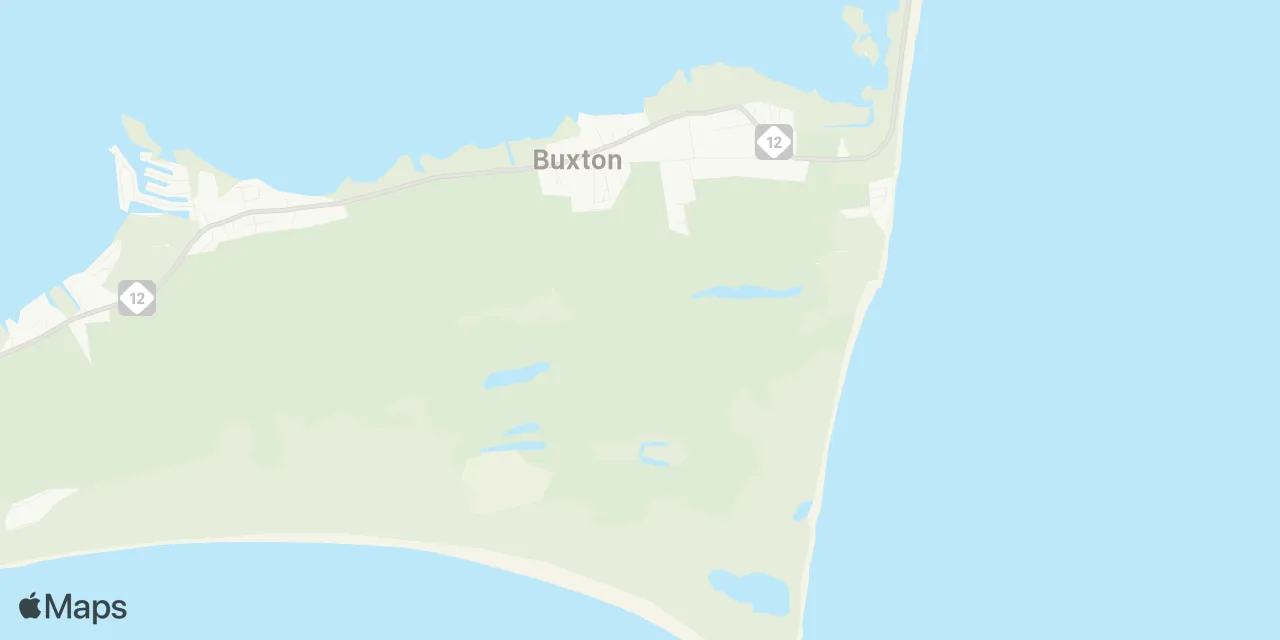
 1
2
3
4
5
6
7
8
1
2
3
4
5
6
7
8
Price per night$20 – $215+
-

 2
2 -
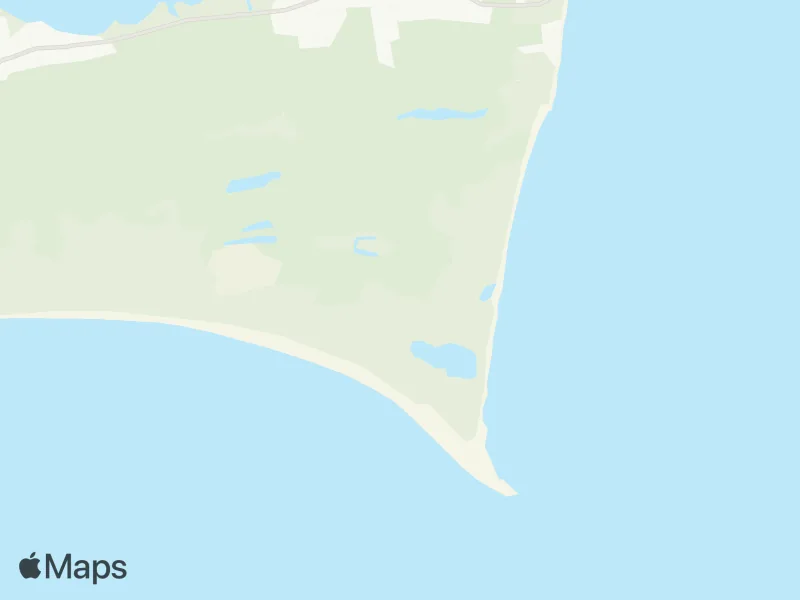
 7
7
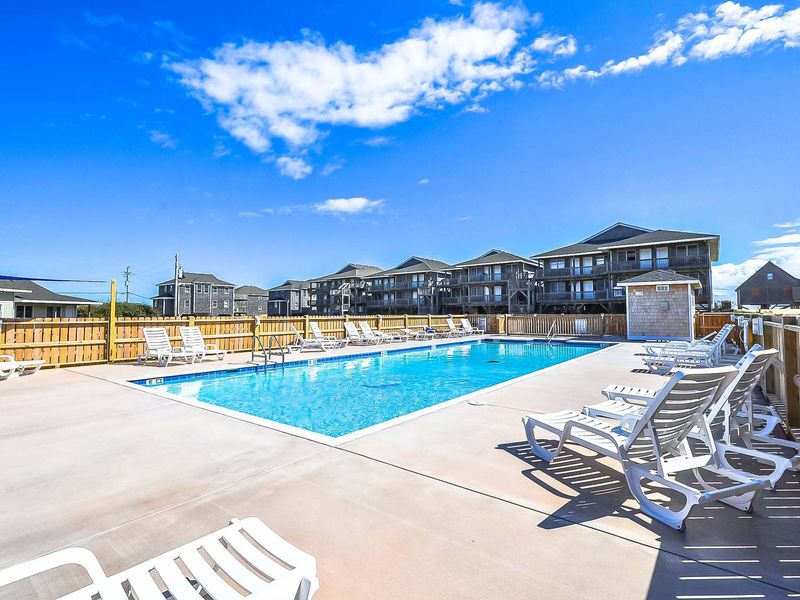
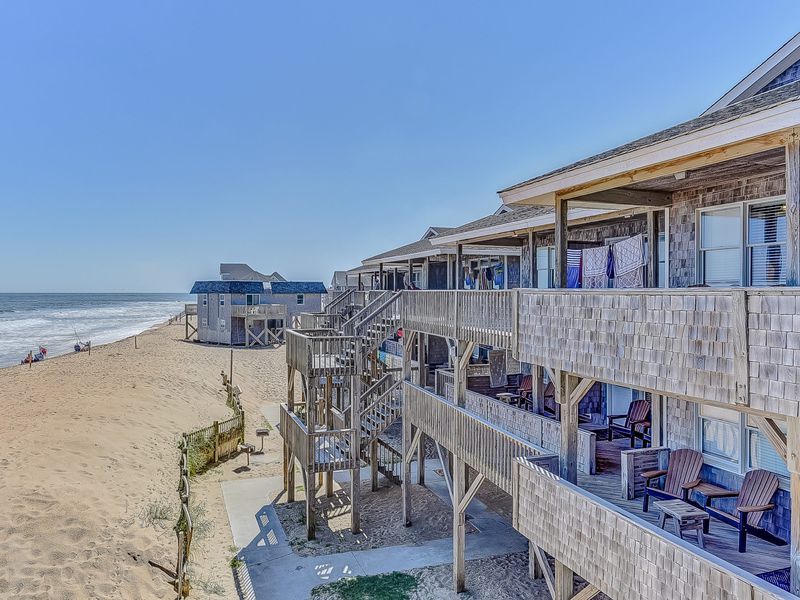
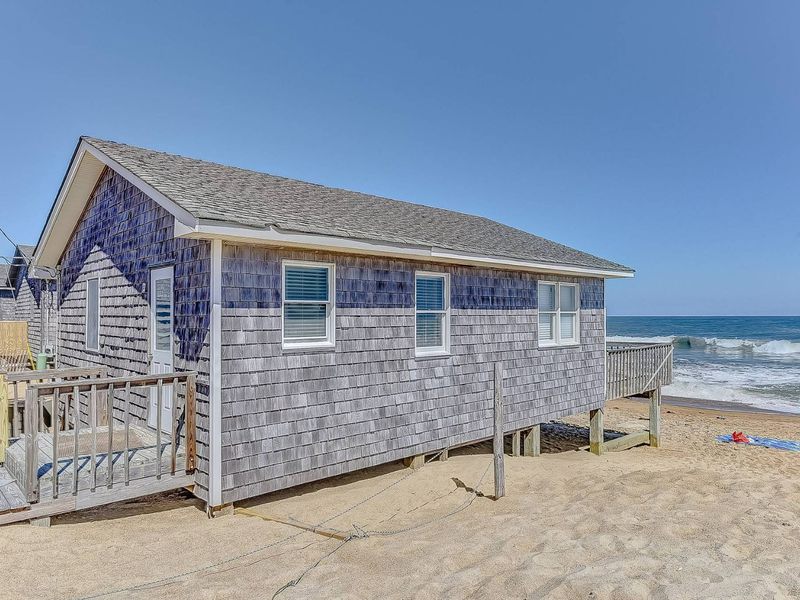
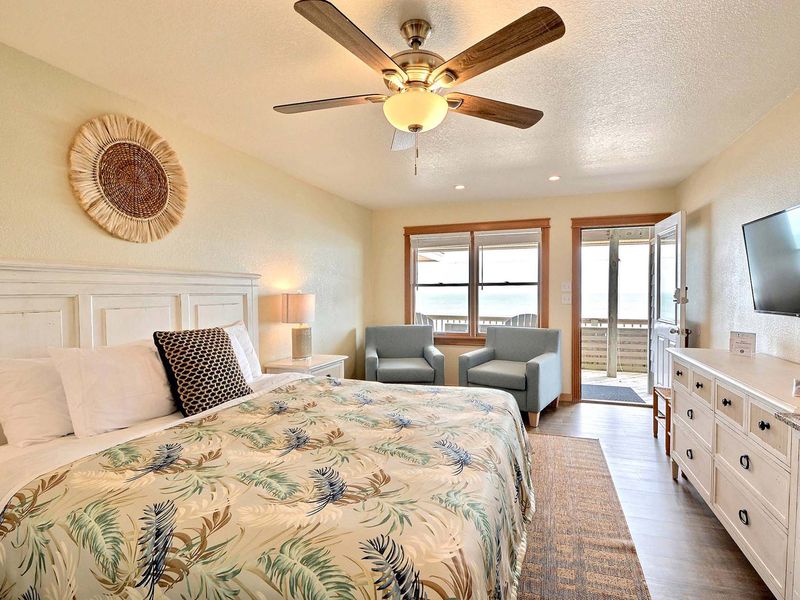
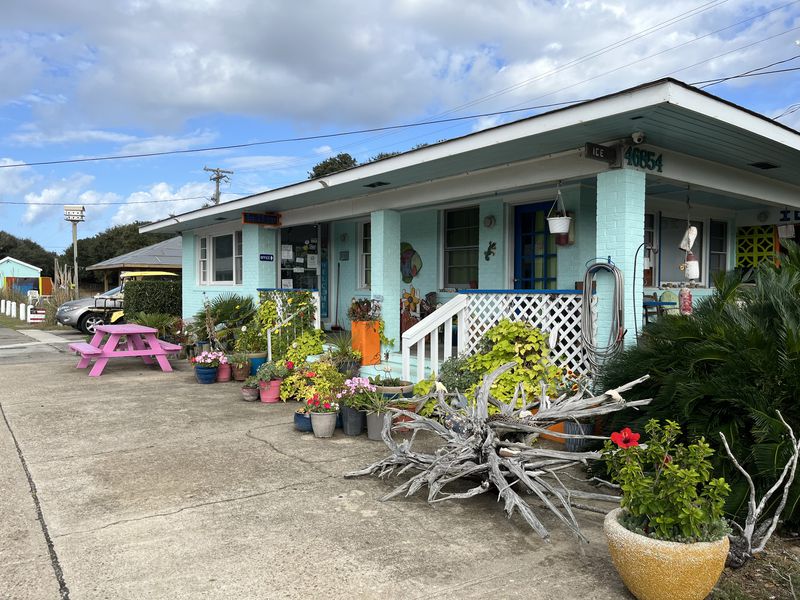
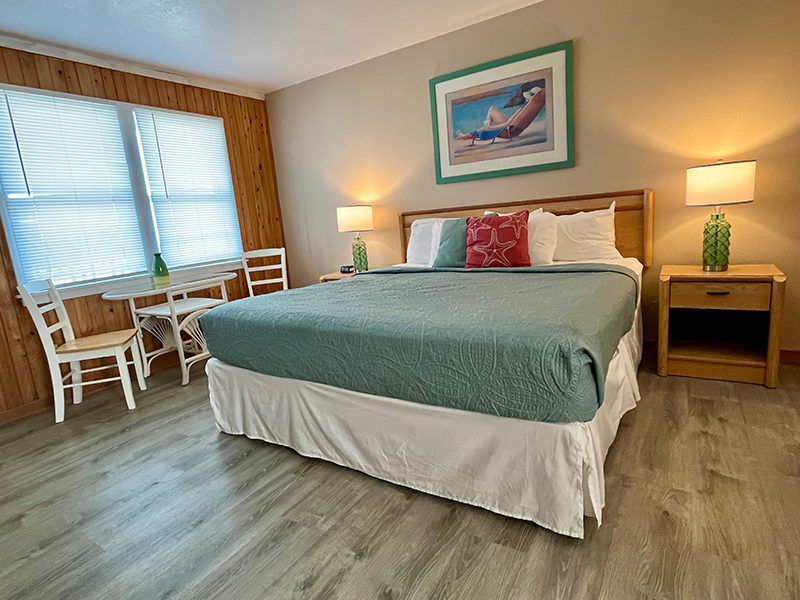
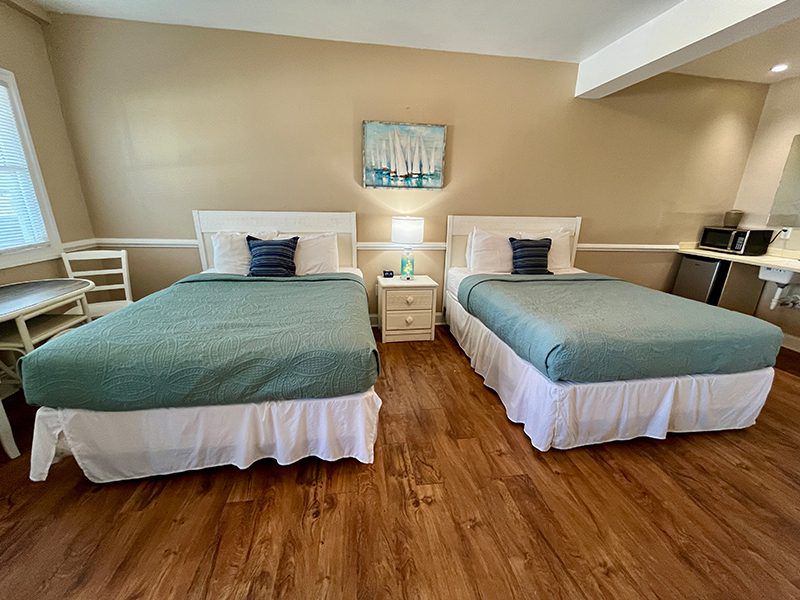
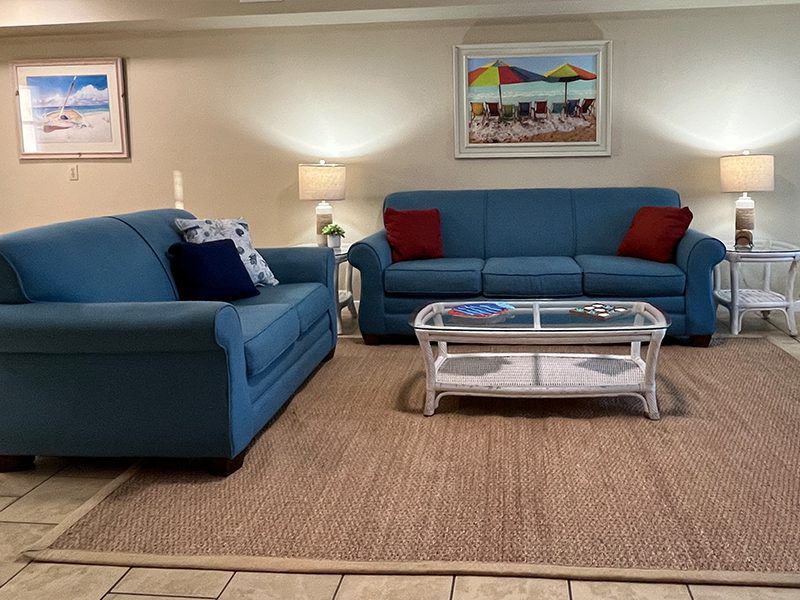
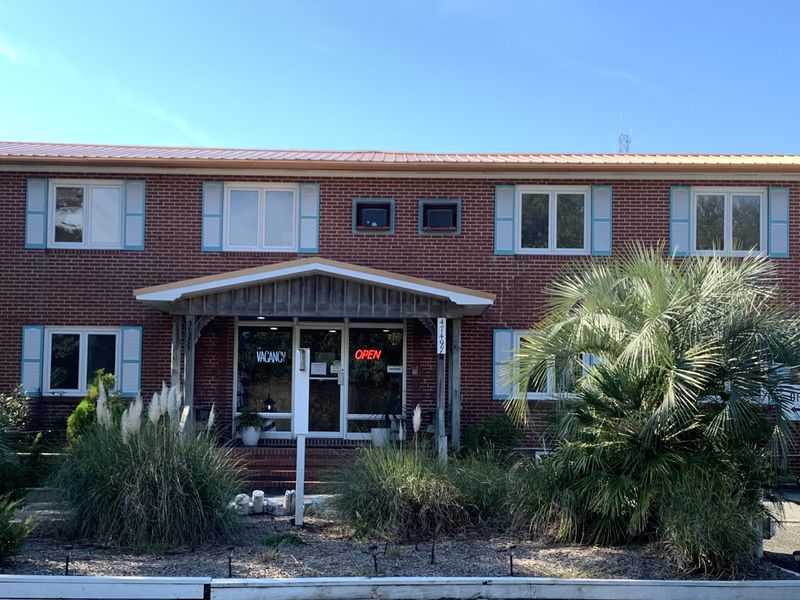
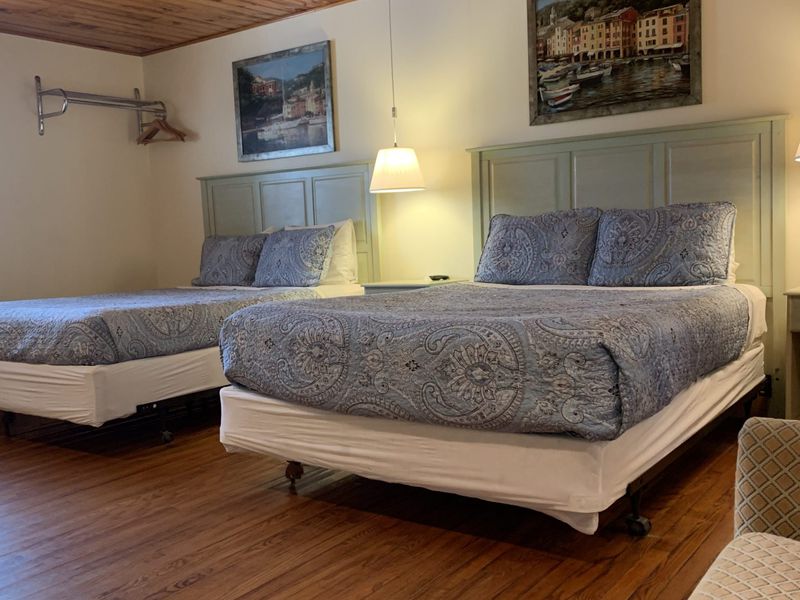
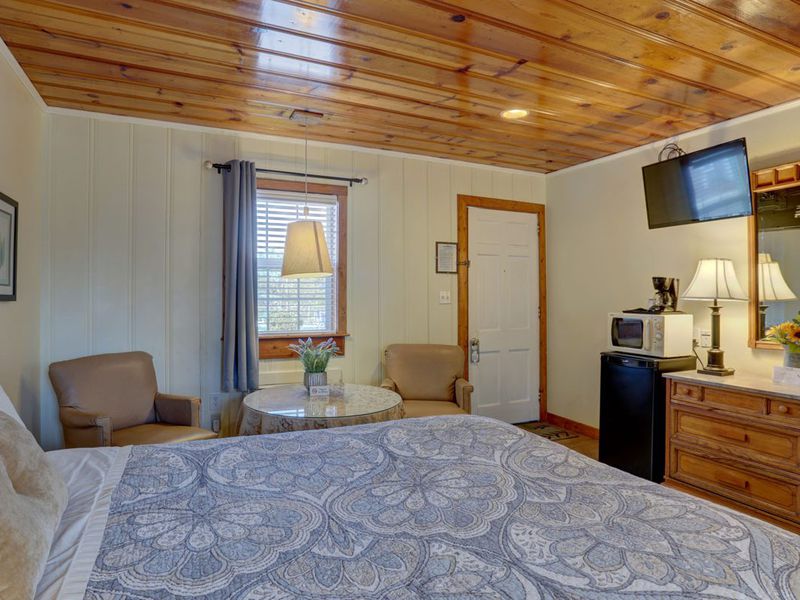
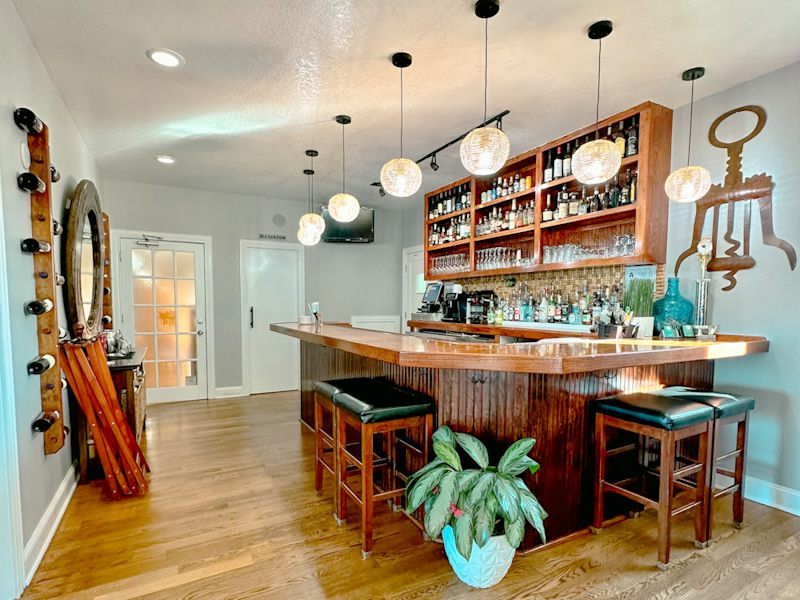
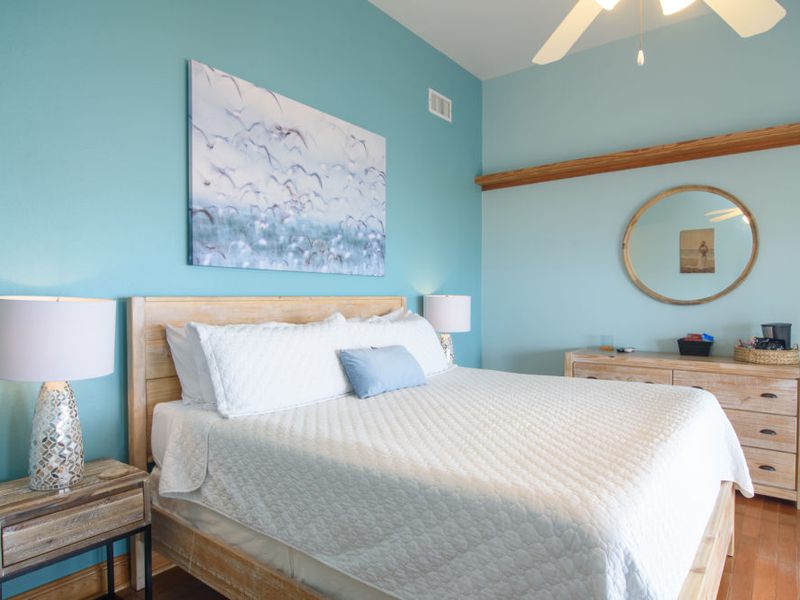
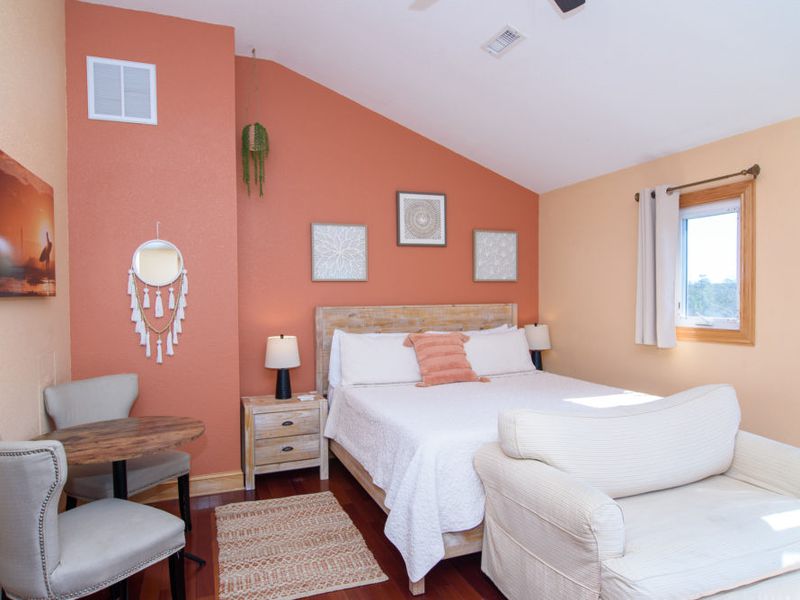
No places in this price range.
Checked Oct 2026
Season
PeakShoulderOff
Best months: all year · typically 2–3 ft faces
Month by month
Every month here is at least half as good as the best one, so there is no season to miss.
| Month | Relative quality | Typical face | Surfable days | Water | Wear | Season |
|---|---|---|---|---|---|---|
| Jan | 2 ft | 23% | 12 C / 53 F | hooded 5/4 | Steady | |
| Feb | 3 ft | 24% | 12 C / 53 F | hooded 5/4 | Best | |
| Mar | 3 ft | 24% | 15 C / 59 F | 4/3 + boots | Steady | |
| Apr | 2 ft | 18% | 19 C / 66 F | 3/2 | Steady | |
| May | 2 ft | 12% | 21 C / 70 F | spring suit | Steady | |
| Jun | 2 ft | 13% | 25 C / 78 F | boardshorts | Steady | |
| Jul | 2 ft | 14% | 27 C / 81 F | boardshorts | Best | |
| Aug | 2 ft | 15% | 27 C / 81 F | boardshorts | Steady | |
| Sep | 3 ft | 24% | 26 C / 78 F | boardshorts | Steady | |
| Oct | 3 ft | 26% | 22 C / 72 F | spring suit | Steady | |
| Nov | 2 ft | 13% | 18 C / 64 F | 4/3 | Steady | |
| Dec | 3 ft | 29% | 15 C / 58 F | 4/3 + boots | Best |
Medians from years of hindcast, not a forecast (how we read the hindcast). Water temperatures come from an offshore model grid, which reads a little warm on an upwelling coast. More on the break in the USA guide.